Flooding, storm frequency and sea level rise are all impacts the UK can expect to see more of due to climate change. The Environment Agency is responsible for operating, maintaining and replacing 78,000 existing flood and coastal defence assets. Together these have a total value of £25 billion and reduce the risk of flooding to 1.8 million households. National and local governments need access to relevant data to ensure sea defences are fit for purpose - whilst ensuring flood and wave warnings are given to the public to best avoid injury and damage to properties.
Monitoring environmental data, such as wave overtopping - when waves breach defences such as sea walls, requires collaborative work between experts. It is essential to bring together specialists in data management, computer and environmental science - and of course, the authorities who will be applying the data to decision-making. Wave overtopping data also has value to schools and use in education resources. The ability to access live data provides a real-world personal perspective to students.
Adding value to sensor data
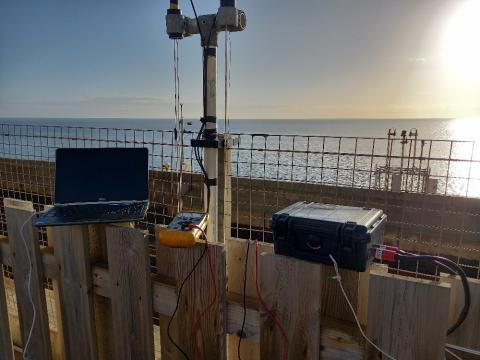
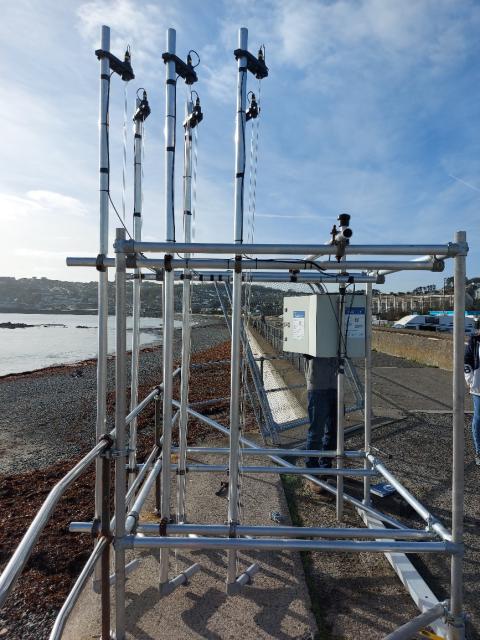
We previously told you about CreamT - the project making near real-time wave data publicly accessible for the first time via the NERC EDS's British Oceanographic Data Centre. This new monitoring system uses sensors at two sites where the sea regularly breaches defences onto a public walkway and railway line. The team created a web-based dashboard called the ‘CreamT Coastal Hazard Explorer’ that made the archived data available in near-real time (within 15 minutes).
When the project ended in summer 2022, Dr Jenny Brown, CreamT’s lead researcher based at the National Oceanography Centre, wanted to ensure the project’s hard work would not be lost;
It was essential that the web-based dashboard we had created continued to be available to those who needed it - for example, local authorities who maintain sea defences or school pupils learning about coastal hazards
The solution to this was moving the dashboard to run on JASMIN - NERC’s data analysis facility for environmental science, ensuring its legacy would continue. This required a demonstrator project to work out how to move the sensor data from the EDS archive (at the BODC), onto JASMIN*, and make it visible on the dashboard in near-real time. The project team, data experts at the EDS (BODC) and infrastructure experts at JASMIN came together to determine requirements and support the dashboard's move to new infrastructure.
The demonstrator project proved it possible to move a near-real time sensor data onto the JASMIN infrastructure. This wouldn’t have been possible if the data had not been produced in a ‘FAIR’ (findable, accessible, interoperable, reproducible) way. Huge value can be added to data with the development of tools that help improve access and enable visualisation of the data, for a variety of audiences and use cases. The EDS, with our key partners like JASMIN, are driving a step change in how environmental data can be accessed. We are working hard to focus our efforts on the co-creation of services that provide our users with relevant and simple to use data.
Other sensor networks collecting near-real time data could learn and improve on this process. Reach out to our helpdesk if you’d like to hear more about this work.
Engaging students in digital skills
The project’s initial aim when creating the dashboard was that it should be simple enough for anyone to use. This made it a suitable tool for education purposes from the outset… albeit not intentionally!
I wanted to engage schools in improving their digital skills - and to show students that science isn’t all about men in white coats
says Dr Jenny Brown. School resources were created to show how the data could be explored and to improve hazard awareness. Three school resources were developed in collaboration with Geography South West for secondary school students. Geography South West host the resources on their website (details below) as the project team felt it was important to share the resources where the intended audience is already engaged.
Different data users bring different requirements, something that became clear when the dashboard was introduced to the classroom. Due to the real-time data processing, the dashboard updates too slowly to be used in lessons. However the current resources can still be used by schools for homework, with the aim that eventually the process will be fast enough for lesson use. Further developments may involve the creation of resources for universities, the environment agency, or additional sensor sites.
Adding value to data requires a diverse set of people to work together. We need problem-solving engineers making cutting-edge technologies, and data specialists checking the data is easily accessible and understandable. Scientists are essential for identifying and creating solutions to real world problems, whilst software developers design computer code to visualise data. All the experts are brought together by creative communicators and project managers who ensure key messages are understood by the relevant people.
As our lives continue to be driven by digital technologies, we must inspire the next generation to understand that a huge range of skills are required to successfully tackle society’s environmental challenges.
* whilst JASMIN is not officially part of the EDS, it is one of our primary partners and is in fact the infrastructure where some of our largest (in volume) datasets are archived.

Direct links to school resources:
- “Dawlish: coastal processes, hazards and management”. A curriculum aligned GCSE case study with worksheet. https://www.geographysouthwest.co.uk/secondary/gcse-articles/dawlish-coastal-processes-hazards-and-management/
- “Investigating waves at Dawlish, Devon: a GIS activity”. A curriculum aligned Key Stage 3 data discovery quiz style worksheet. https://www.geographysouthwest.co.uk/secondary/ks3-articles/investigating-waves-at-dawlish-devon-a-gis-activity/
- “Investigating coastal wave processes using GIS”. A curriculum aligned A-Level assignment. https://www.geographysouthwest.co.uk/secondary/16-plus-articles/investigating-coastal-wave-processes-using-gis/